博客内容Blog Content
支持向量机原理和代码 Principle & Code of Support Vector Machine (SVM)
简单介绍支持向量机原理,高斯核函数、松弛因子参数和分类应用代码实例 A brief introduction to the principle of Support Vector Machines (SVM), Gaussian kernel function, slack variable parameter, and a code example for classification applications.
引言 Introduction
在机器学习中,支持向量机SVM是最经典的算法之一,它是常见的一种分类方法,应用领域也非常广,其效果自然也是很厉害的。本文简要介绍支持向量机算法原理,和代码实现
In machine learning, Support Vector Machine (SVM) is one of the most classic algorithms and a common classification method. It is widely applied across various fields, and its effectiveness is naturally impressive. This article provides a brief introduction to the principles of the SVM algorithm and its code implementation.
原理 Principle
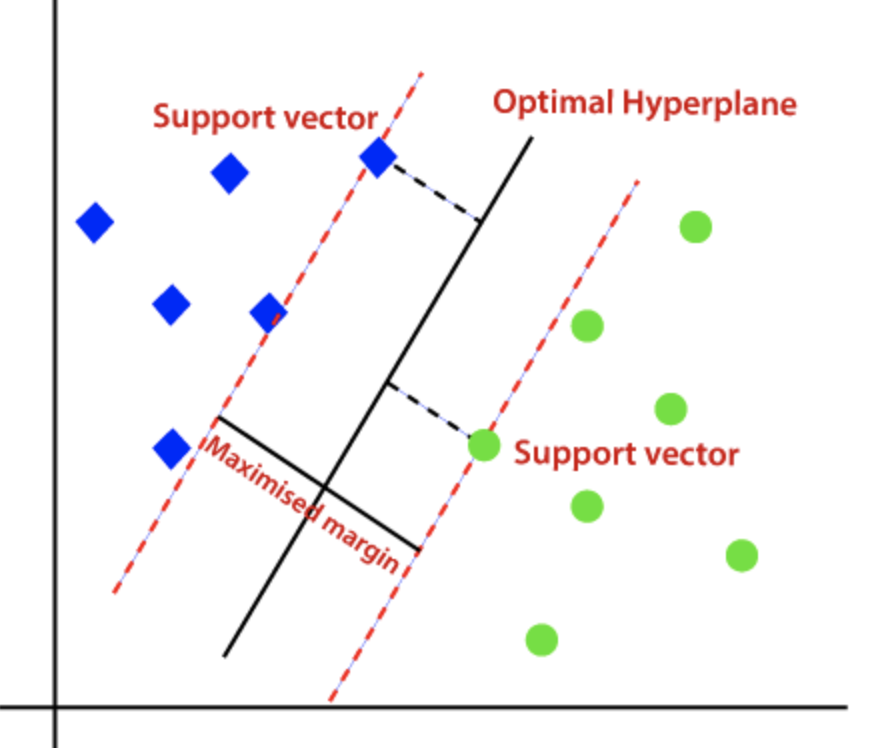
我们把这个划分数据的决策边界就叫做超平面。离这个超平面最近的点就是”支持向量”,点到超平面的距离叫做间隔
We call the decision boundary that separates the data the "hyperplane." The points closest to this hyperplane are the "support vectors," and the distance from these points to the hyperplane is called the "margin."
支持向量机的算法核心原理是“尽可能最大化到划分边界的点的最小距离”,这样才可以使两类样本准确地分开。
The core principle of the Support Vector Machine algorithm is to "maximize the minimum distance to the points on the decision boundary as much as possible.", ensuring that the two classes of samples are accurately separated.
期间会使用软间隔参数C和高斯核函数参数gamma对容错率和升降维度复杂程度进行控制
During this process, the soft margin parameter C and the Gaussian kernel function parameter gamma are used to control the tolerance for errors and the complexity of dimensionality scaling.
SVM推导过程涉及点到平面距离计算以及拉格朗日乘法的使用,较为复杂,这边暂不记录
SVM derivation involves calculating the distance from a point to a plane and the use of Lagrange multipliers, which is relatively complex, so it will not be documented here for now.
代码 Code
SVM线性模型 SVM Linear Model
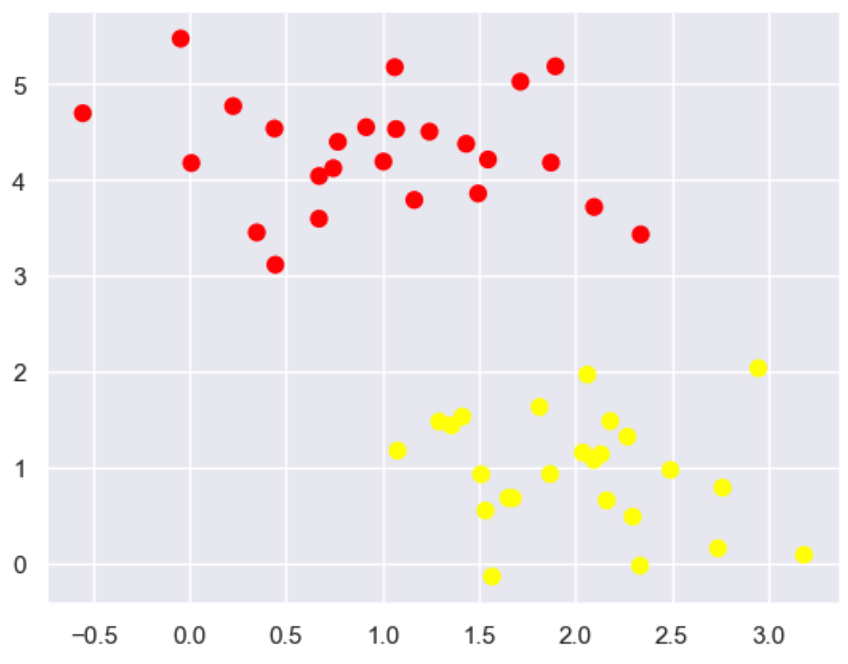
绘制散点
Plotting Scatter Points
# 随机采样点数据
# 其中 cluster_std是数据的离散程度

from sklearn.datasets import make_blobs
import matplotlib.pyplot as plt
X, y = make_blobs(n_samples=50, centers=2,
                  random_state=0, cluster_std=0.60)
plt.scatter(X[:, 0], X[:, 1], c=y, s=50, cmap='autumn')
plt.show()
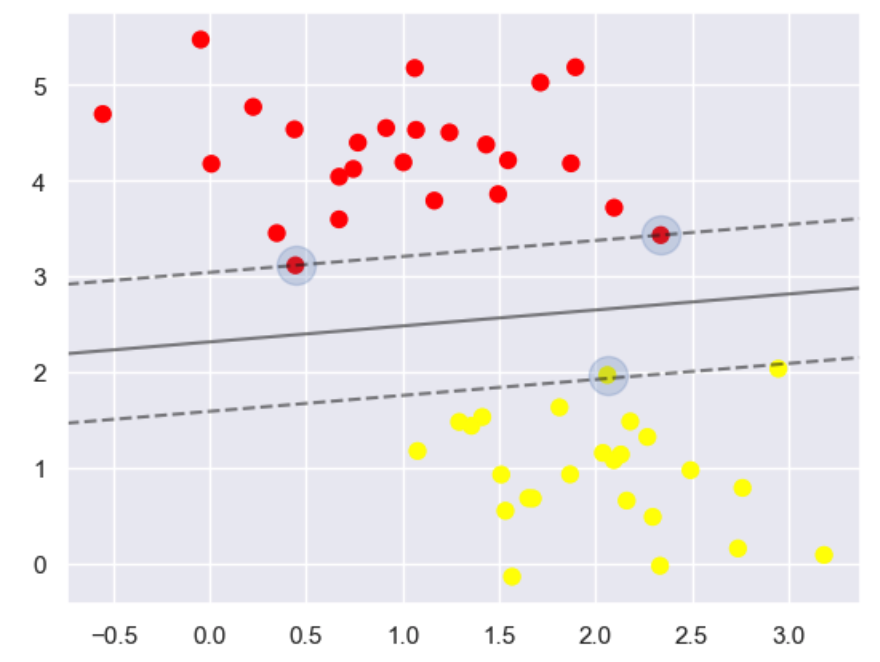
构建SVM线性模型,并且画线
Build an SVM Linear Model and Draw the Line
#分类任务
from sklearn.svm import SVC

#线性核函数 相当于不对数据进行变换
model = SVC(kernel='linear')
model.fit(X, y)
#绘图函数
def plot_svc_decision_function(model, ax=None, plot_support=True):

    if ax is None:
        ax = plt.gca()
    xlim = ax.get_xlim()
    ylim = ax.get_ylim()

    # 用SVM自带的decision_function函数来绘制
    x = np.linspace(xlim[0], xlim[1], 30)
    y = np.linspace(ylim[0], ylim[1], 30)
    Y, X = np.meshgrid(y, x)
    xy = np.vstack([X.ravel(), Y.ravel()]).T
    P = model.decision_function(xy).reshape(X.shape)

    # 绘制决策边界
    ax.contour(X, Y, P, colors='k',
               levels=[-1, 0, 1], alpha=0.5,
               linestyles=['--', '-', '--'])

    # 绘制支持向量
    if plot_support:
        ax.scatter(model.support_vectors_[:, 0],
                   model.support_vectors_[:, 1],
                   s=300, linewidth=1, alpha=0.2);
    ax.set_xlim(xlim)
    ax.set_ylim(ylim)

plt.scatter(X[:, 0], X[:, 1], c=y, s=50, cmap='autumn')
plot_svc_decision_function(model)
线性绘图的问题 Problems of linear plotting
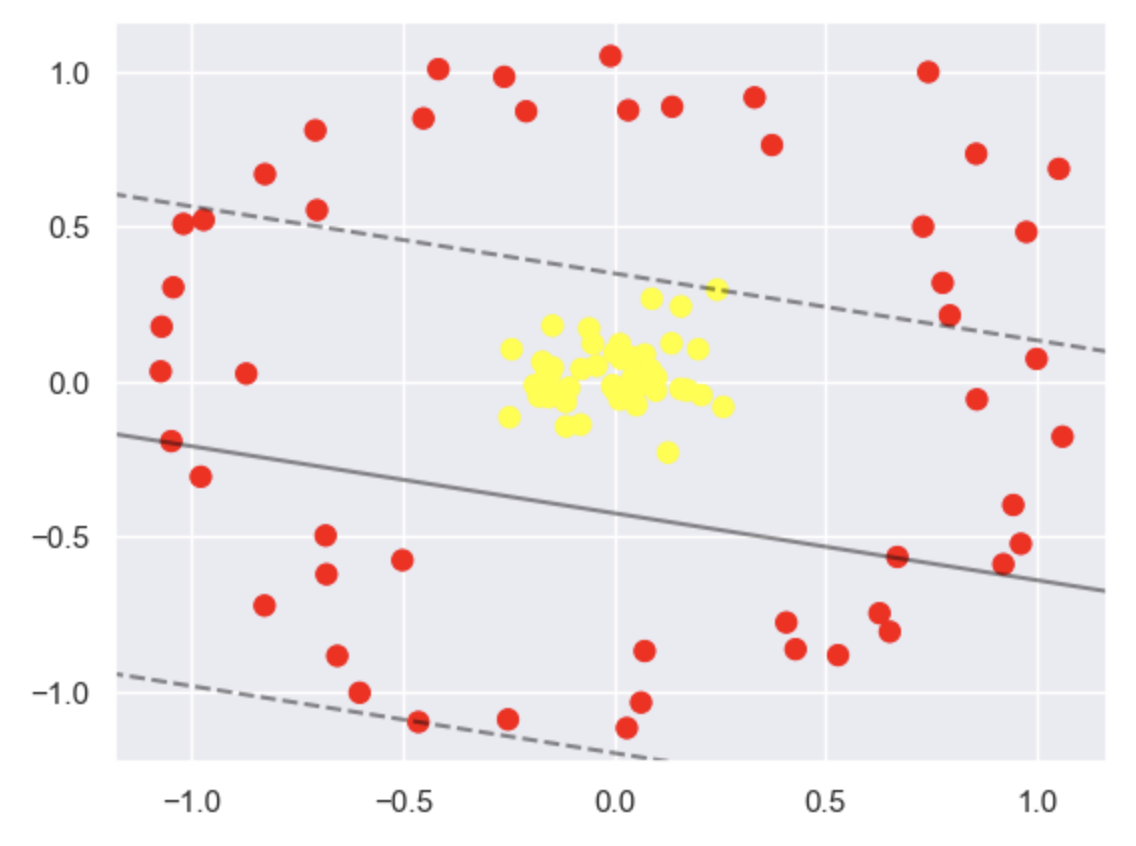
绘制散点,仍旧尝试使用线性绘图,发现效果不佳
Plotting scatter points while till attempting SVM linear plotting, finding it ineffective
from sklearn.datasets import make_circles
import matplotlib.pyplot as plt
from sklearn.svm import SVC
# 生成数据集
X, y = make_circles(100, factor=.1, noise=.1)
# 训练线性SVM模型
clf = SVC(kernel='linear').fit(X, y)
# 绘制数据点
plt.scatter(X[:, 0], X[:, 1], c=y, s=50, cmap='autumn')
# 绘制决策边界
plot_svc_decision_function(clf, plot_support=False)
plt.show()
数据映射高维度 Data Mapping to High Dimensions
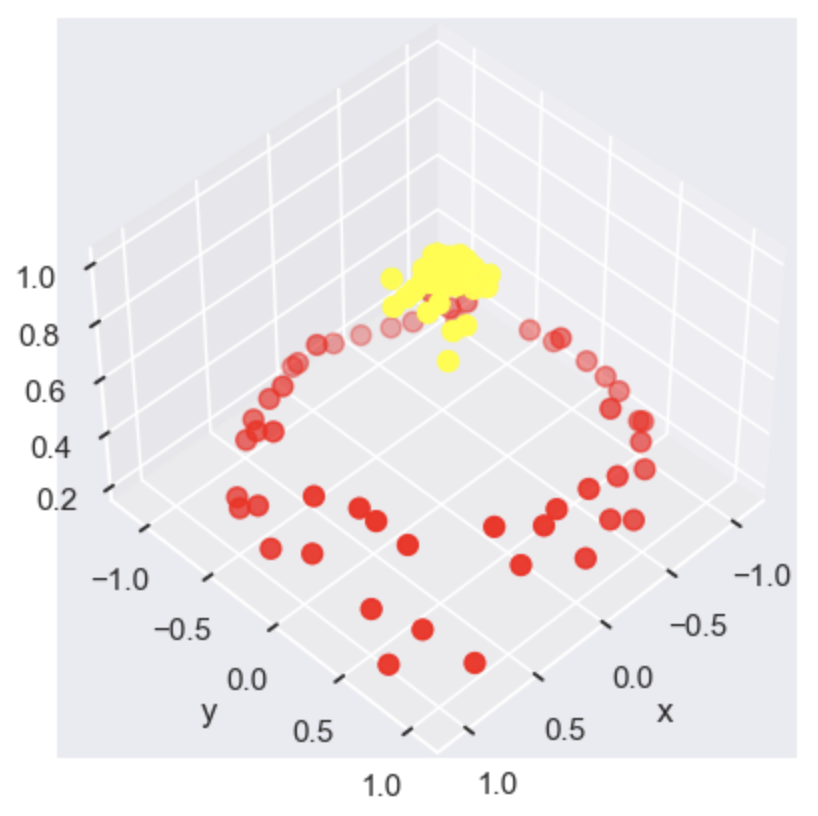
上图为线性SVM在解决环绕形数据集时得到的效果。虽然在二维特征空间中做得不 好,但如果映射到高维空间中,效果会不会好一些呢?可以想象一下三维空间中的效果:
The image above shows the result of a linear SVM when applied to a circular data set. Although it doesn't perform well in the two-dimensional feature space, would it perform better if mapped to a higher-dimensional space? Imagine the effect in a three-dimensional space:
#加入了新的维度r
from mpl_toolkits import mplot3d
r = np.exp(-(X ** 2).sum(1))

# 可以想象一下在三维中把环形数据集进行上下拉伸
def plot_3D(elev=30, azim=30, X=X, y=y):
    ax = plt.subplot(projection='3d')
    ax.scatter3D(X[:, 0], X[:, 1], r, c=y, s=50, cmap='autumn')
    ax.view_init(elev=elev, azim=azim)
    ax.set_xlabel('x')
    ax.set_ylabel('y')
    ax.set_zlabel('r')
plot_3D(elev=45, azim=45, X=X, y=y)
使用高斯核函数划分
Using a Gaussian Kernel Function for Classification
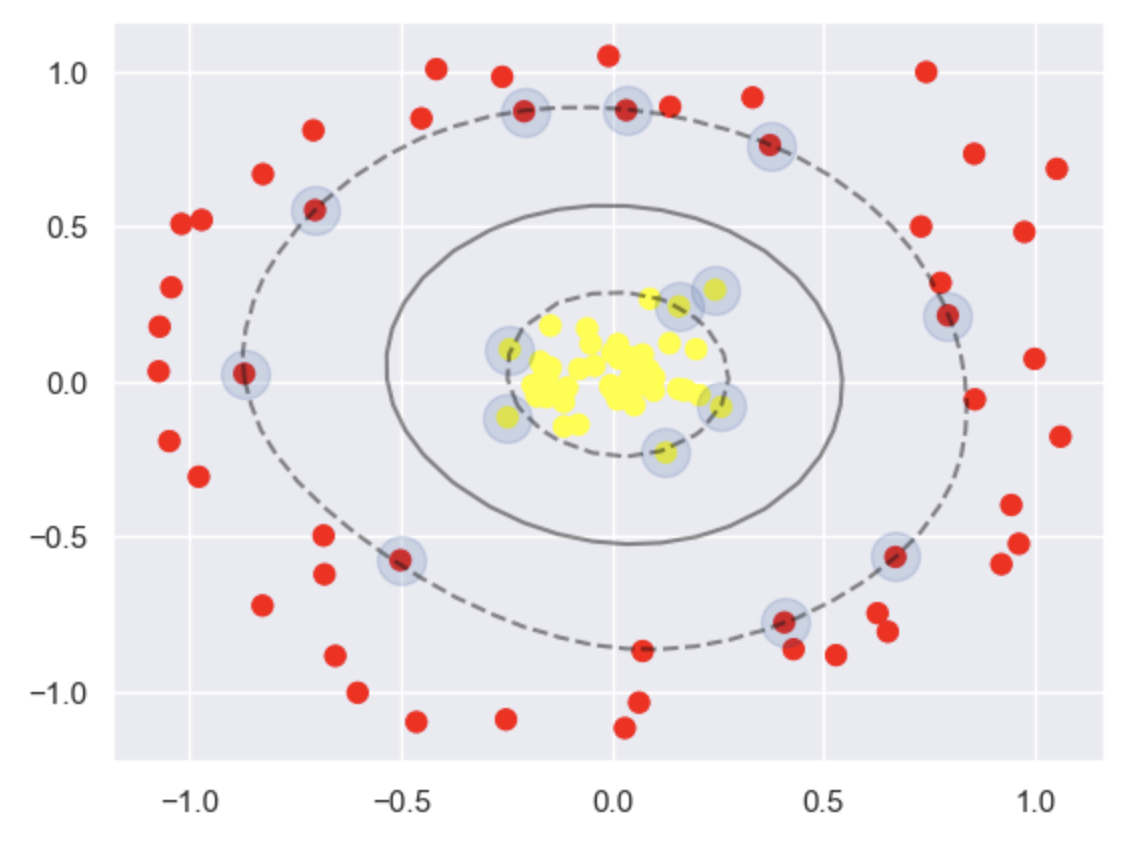
上述代码自定义了一个新的维度,此时两类数据点很容易分开,这就是核函数变换的基本思想,下面使用高斯核函数完成同样的任务:
The code above customizes a new dimension, making it easy to separate the two classes of data points. This is the basic idea behind kernel function transformations. Next, we will use a Gaussian kernel function to accomplish the same task:
# 加入高斯核函数
# 使用了径向基函数(Radial Basis Function, RBF)核来训练支持向量机(SVM)
clf = SVC(kernel='rbf')
clf.fit(X, y)
# 这回厉害了!
plt.scatter(X[:, 0], X[:, 1], c=y, s=50, cmap='autumn')
plot_svc_decision_function(clf)
plt.scatter(clf.support_vectors_[:, 0], clf.support_vectors_[:, 1],
            s=300, lw=1, facecolors='none');
参数“松弛因子”对分类的影响
Impact of the "Slack Variable" Parameter on Classification
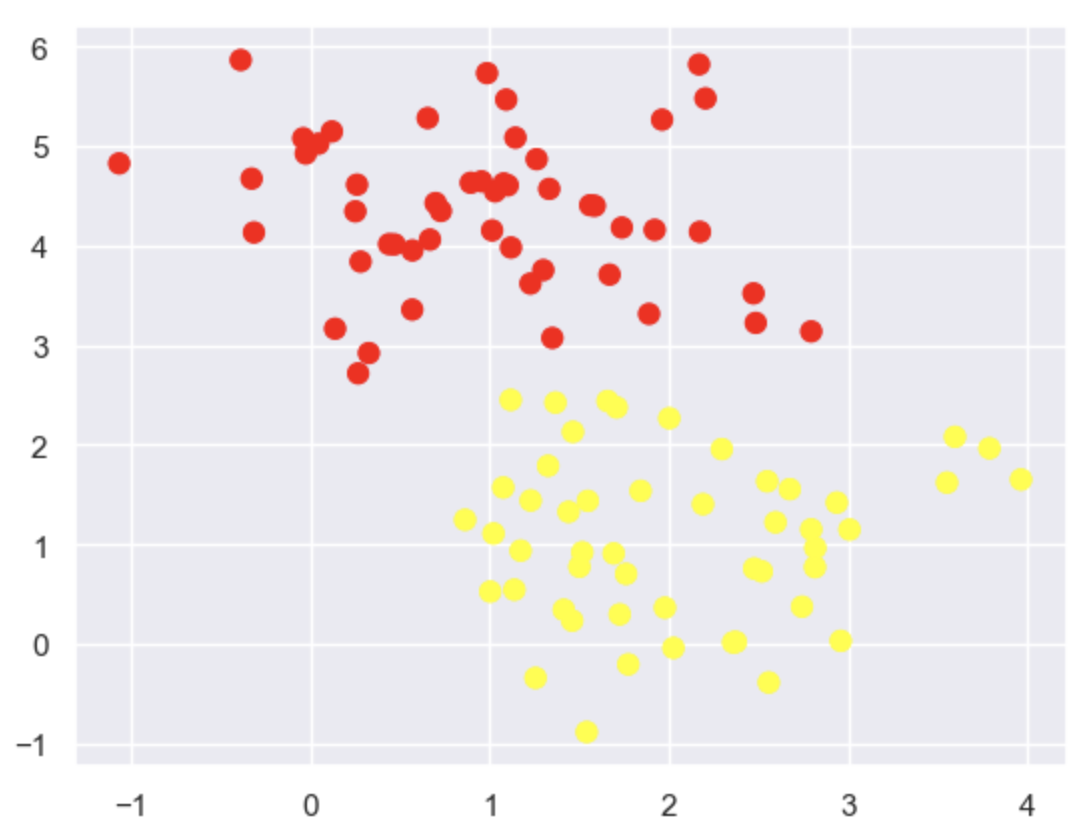
讲解支持向量机的原理时,曾提到过拟合问题,也就是软间隔(Soft Margin),其中松弛因子C用于控制标准有多严格。当C趋近于无穷大时,这意味着分类要求严格,不能 有错误;当C趋近于无穷小时,意味着可以容忍一些错误。下面通过数据集实例验证其参数的大小对最终 支持向量机模型的影响。首先生成一个模拟数据集,代码如下:
When explaining the principles of Support Vector Machines (SVM), the concept of overfitting was mentioned, which relates to the soft margin. The slack variable C is used to control how strict the margin is. When C approaches infinity, it signifies that the classification requirement is strict, allowing no errors. Conversely, when C approaches zero, it means that some errors can be tolerated. Below, we will verify the effect of the parameter size on the final SVM model using a dataset example. First, let's generate a simulated dataset with the following code:
# 这份数据集中cluster_std稍微大一些,这样才能体现出软间隔的作用
# cluster_std 参数越大,数据点在各自簇中心周围的分布就越松散,簇之间的边界也就越模糊
X, y = make_blobs(n_samples=100, centers=2,
                  random_state=0, cluster_std=0.8)
plt.scatter(X[:, 0], X[:, 1], c=y, s=50, cmap='autumn')
进一步加大游戏难度,来看一下松弛因子C可以发挥的作用:
Increasing the Difficulty: Exploring the Role of the Slack Variable C
# 加大游戏难度的数据集
X, y = make_blobs(n_samples=100, centers=2,
                  random_state=0, cluster_std=0.8)
fig, ax = plt.subplots(1, 2, figsize=(16, 6))
fig.subplots_adjust(left=0.0625, right=0.95, wspace=0.1)

# 选择两个C参数来进行对别实验,分别为10和0.1
for axi, C in zip(ax, [10.0, 0.1]):
    model = SVC(kernel='linear', C=C).fit(X, y)
    axi.scatter(X[:, 0], X[:, 1], c=y, s=50, cmap='autumn')
    plot_svc_decision_function(model, axi)
    axi.scatter(model.support_vectors_[:, 0],
                model.support_vectors_[:, 1],
                s=300, lw=1, facecolors='none');
    axi.set_title('C = {0:.1f}'.format(C), size=14)
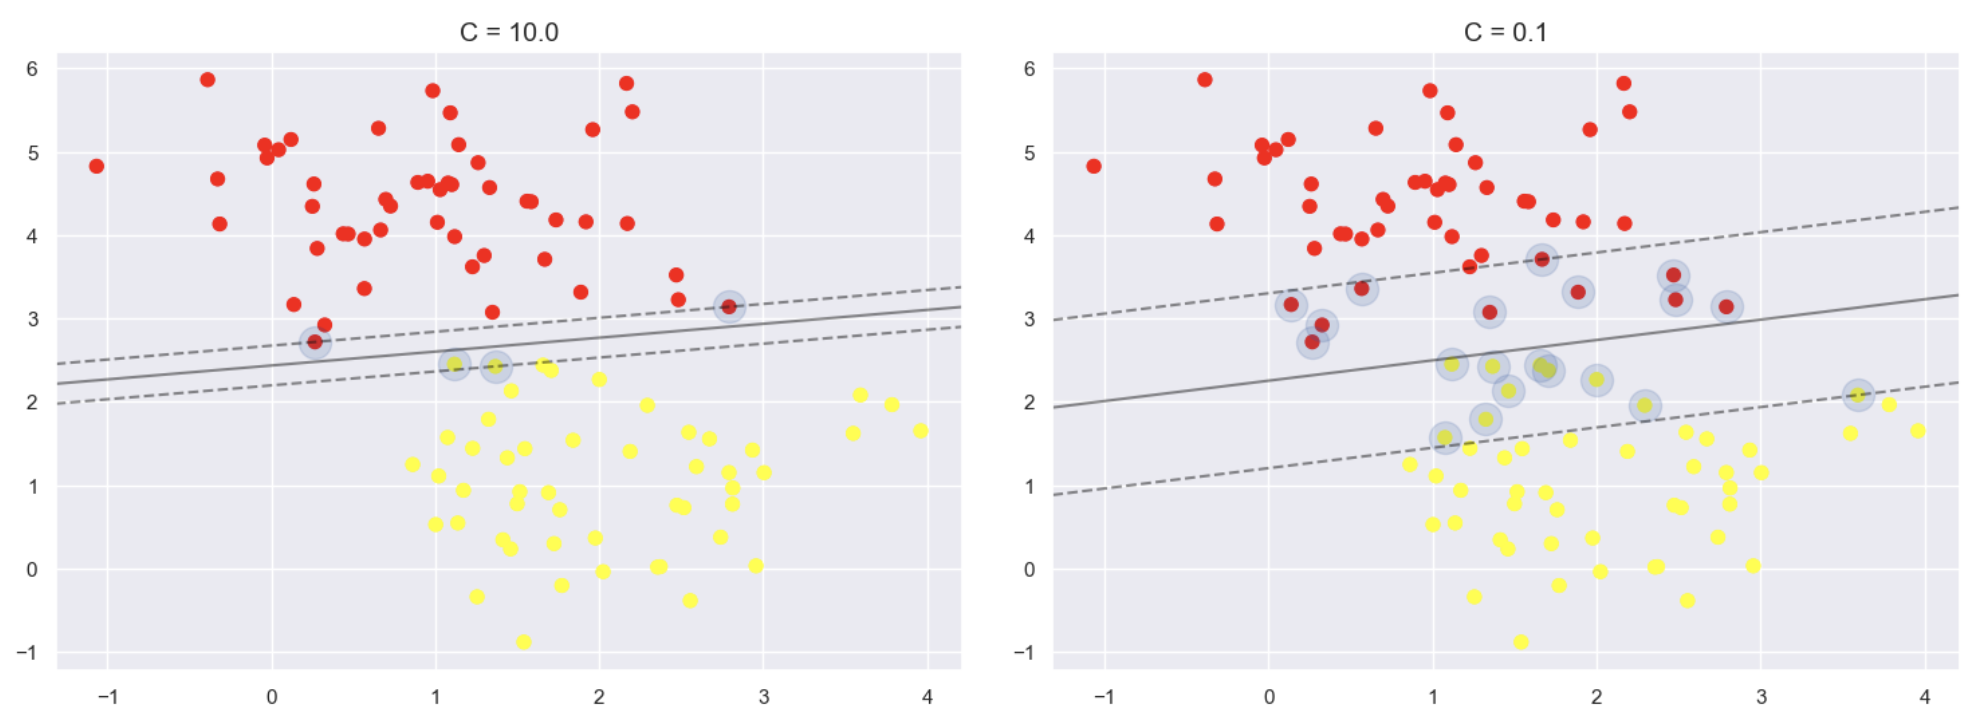
上述代码设定松弛因子控制参数C的值分别为10和0.1,其他参数保持不变,使用同一数据集训练支 持向量机模型。上面左图对应松弛因子控制参数C为10时的建模结果,相当于对分类的要求比较严格,以 分类对为前提,再去找最宽的决策边界,得到的结果虽然能够完全分类正确,但是边界实在是不够宽。 右图对应松弛因子控制参数C为0.1时的建模结果,此时并不要求分类完全正确,有点错误也是可以容忍 的,此时得到的结果中,虽然有些数据点“越界”了,但是整体还是很宽的。
In the code above, the slack variable control parameter C is set to 10 and 0.1, respectively, while keeping other parameters constant. The same dataset is used to train the Support Vector Machine (SVM) model. The left image above corresponds to the modeling result when C is set to 10, which implies stricter classification requirements. The goal is to find the widest decision boundary under the premise of correct classification. While the result is perfectly classified, the margin is not wide enough. The right image corresponds to the modeling result when C is set to 0.1. In this case, perfect classification is not required, and some errors are tolerable. Although a few data points "cross the boundary," the overall margin is much wider.
对比不同松弛因子控制参数C对结果的影响后,结果的差异还是很大,所以在实际建模的时候,需要 好好把控C值的选择,可以说松弛因子是支持向量机中的必调参数,当然具体的数值需要通过实验判断。
By comparing the impact of different slack variable control parameters C on the results, we can see that the differences are significant. Therefore, when building a model, careful selection of the C value is crucial. The slack variable is a key parameter that must be tuned in SVMs, and the optimal value of C should be determined through experimentation.
高斯核函数参数gamma对分类的影响
Impact of the Gaussian Kernel Function Parameter γ on Classification
高斯核函数 可以通过改变σ值进行不同的数据变换,在 sklearn工具包中,σ对应着gamma参数值,以控制模型的复杂程度。gamma值越大,模型复杂度越高;而 gamma值越小,则模型复杂度越低。先进行实验,看一下其具体效果:
The Gaussian kernel function can perform different data transformations by adjusting the value of σ. In the sklearn toolkit, σ corresponds to the gamma parameter, which controls the complexity of the model. A higher gamma value increases the model's complexity, while a lower gamma value decreases it. Let's conduct an experiment to observe the specific effects of different gamma values:
X, y = make_blobs(n_samples=100, centers=2,
                  random_state=0, cluster_std=1.1)
fig, ax = plt.subplots(1, 4, figsize=(16, 6))
fig.subplots_adjust(left=0.0625, right=0.95, wspace=0.1)

# 选择不同的gamma值来观察建模效果
for axi, gamma in zip(ax, [10.0, 5.0, 1.0, 0.1]):
    model = SVC(kernel='rbf', gamma=gamma).fit(X, y)
    axi.scatter(X[:, 0], X[:, 1], c=y, s=50, cmap='autumn')
    plot_svc_decision_function(model, axi)
    axi.scatter(model.support_vectors_[:, 0],
                model.support_vectors_[:, 1],
                s=300, lw=1, facecolors='none');
    axi.set_title('gamma = {0:.1f}'.format(gamma), size=14)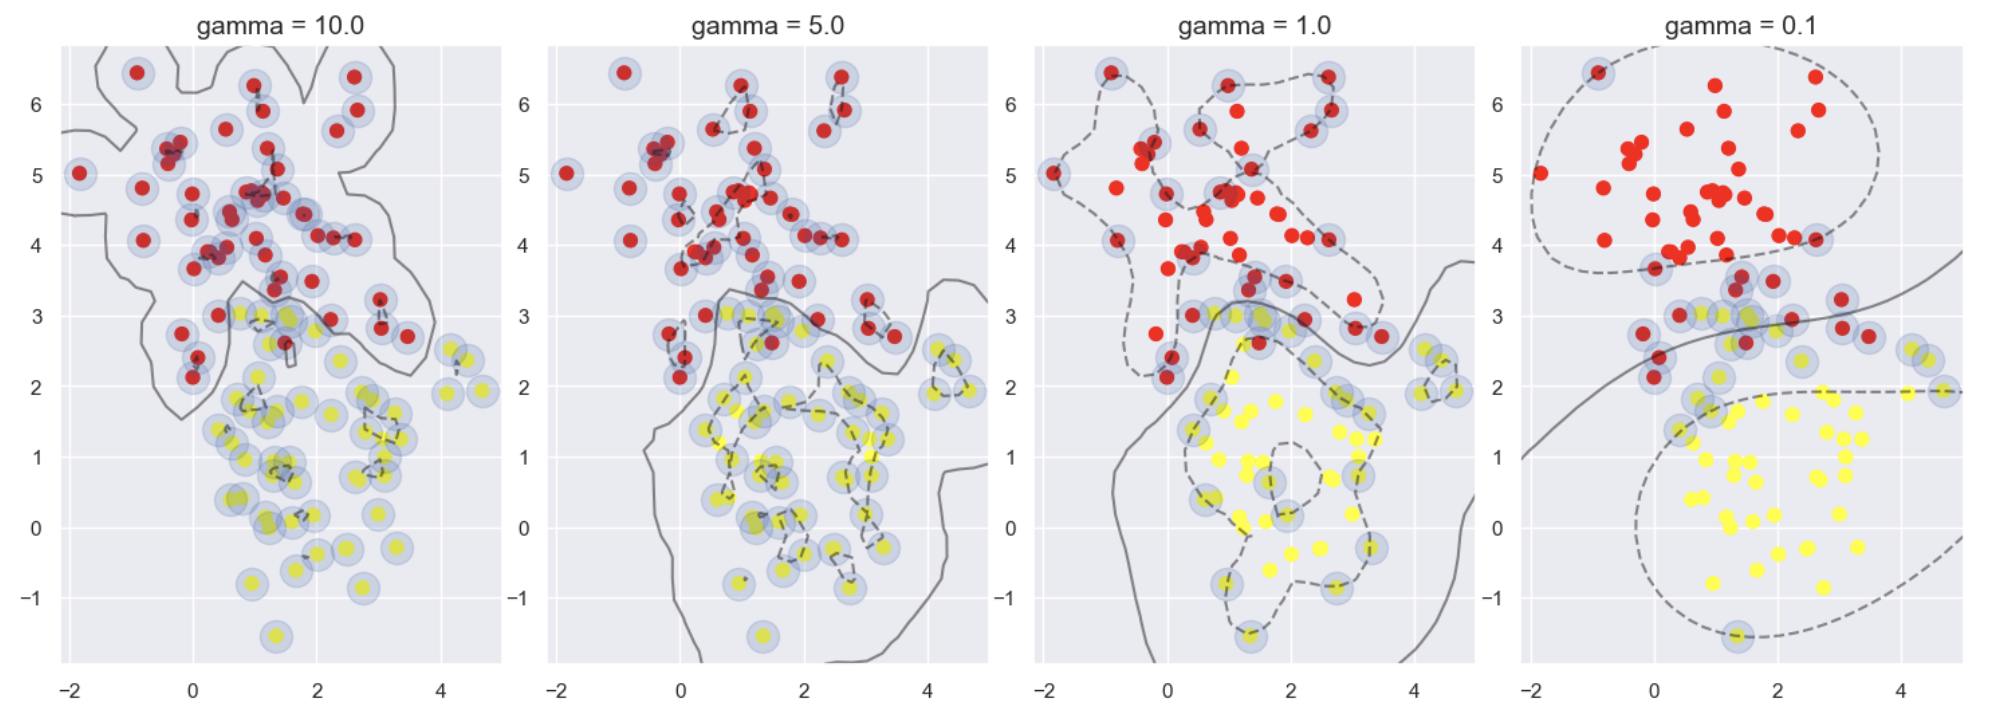
上述代码设置gamma值分别为10到0.1,以观察建模的结果。上面左图为gamma取10时的输出结果, 训练后得到的模型非常复杂,虽然可以把所有的数据点都分类正确,但是一看其决策边界,就知道这样 的模型过拟合风险非常大。右图为gamma取0.1时的输出结果,模型并不复杂,有些数据样本分类结果出 现错误,但是整体决策边界比较平稳。
The code above sets the gamma value to 10 and 0.1, respectively, to observe the modeling results. The left image above shows the output when gamma is set to 10. The resulting model is highly complex; although it classifies all data points correctly, the decision boundary indicates a very high risk of overfitting. The right image shows the output when gamma is set to 0.1. In this case, the model is not as complex, and some data points are misclassified, but the overall decision boundary is more stable.
那么,究竟哪个参数好呢?一般情况下,需要通过交叉验证进行 对比分析,但是,在机器学习任务中,还是希望模型别太复杂,泛化能力强一些,才能更好地处理实际 任务,因此,相对而言,右图中模型更有价值。
So, which parameter is better? In general, cross-validation is needed for comparative analysis. However, in machine learning tasks, we usually prefer models that are less complex and have stronger generalization ability, which allows them to handle real-world tasks better. Therefore, relatively speaking, the model shown in the right image is more valuable.
